
Gaxce Sensors

Author name: Rohan Gaxce

Uncategorized

Full CAN Bus Logging with VBOX 4

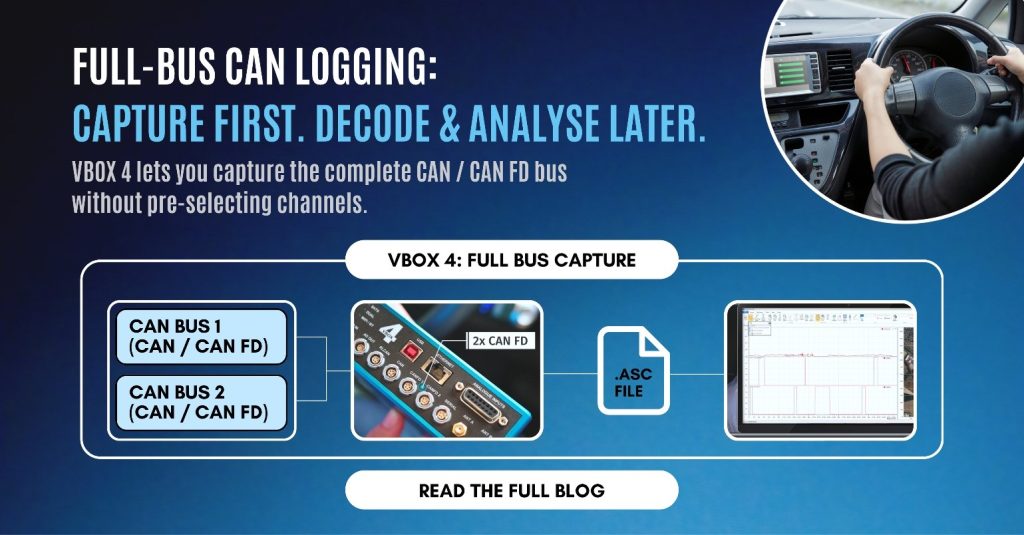
The Complete Guide to Capturing Every Signal on Your Vehicle’s Network If you’ve ever finished a test run only to realise the one CAN signal you needed wasn’t in your channel list, you already know why “log everything, decide later” has become the standard for serious vehicle testing. That’s exactly the problem VBOX 4 was built to solve. This guide covers everything engineers, test technicians, and OEM data teams need to know about full CAN and CAN FD logging with VBOX 4 — how it works under the hood, what makes it different from selective CAN logging, and how to get it running on your next test.   VBOX 4 captures a vehicle’s entire CAN bus — including CAN FD — automatically and continuously, with no need to pre-select individual channels before a test. It does this through four isolated, hardware-independent CAN ports (RL CAN, CAN, CAN FD 1, CAN FD 2), letting it record two full vehicle CAN buses simultaneously into a single, GNSS-time-synchronised .asc file. Channel selection happens after the test, in VBOX Test Suite, so nothing is ever lost to a misconfigured logger or an unplanned signal need. Why “Log Now, Select Later” Matters Traditional CAN loggers force you to decide, before you drive, exactly which signals matter. That works fine when you know precisely what you’re testing for. It falls apart the moment: Full-bus logging removes that risk entirely. VBOX 4 records every frame on the bus, unfiltered, and lets you decide afterwards what matters. Nothing is discarded at capture time, so a single test run can answer questions nobody had thought to ask yet. What “Full CAN Logging” Actually Means on VBOX 4 Full CAN logging is the automatic, unfiltered capture of every message travelling on a vehicle’s CAN or CAN FD bus, without requiring the operator to define a channel list, DBC mapping, or trigger condition beforehand. On VBOX 4, this is a hardware-level capability, not a configuration workaround — the raw bus traffic is written to disk exactly as it appears on the wire. That distinction matters. Some loggers claim full-bus capture but actually apply filtering or downsampling under load. VBOX 4 logs raw, timestamped CAN and CAN FD frames straight to an industry-standard .asc file, which any downstream CAN analysis tool — not just Racelogic’s own software — can open. Inside VBOX 4’s CAN Architecture: Four Ports, Two Full Buses This is where VBOX 4 goes further than most competitors, and it’s worth understanding the layout in detail because it directly affects how you wire and configure a test: Port Purpose RL CAN Dedicated to Racelogic modules and displays (e.g. TC8 thermocouple modules, FIM03, MFD Touch display). Supports up to 32 Racelogic module channels, auto-recognised the moment they’re connected. CAN General-purpose port for input and/or output of standard CAN 2.0 frames — can transmit up to 8 user-configured CAN messages and 16 signals out to a third-party system via CAN Pass Through. CAN FD 1 Input-only port for full raw-bus logging of either CAN FD or CAN 2.0 traffic to .asc. CAN FD 2 A second, fully independent input-only port for full raw-bus logging — meaning VBOX 4 can capture two separate vehicle CAN buses at the same time. Because all four ports are electrically isolated from each other, you can connect to sensitive OEM prototype networks without introducing noise, ground loops, or the risk of disturbing the vehicle’s own bus behaviour — a common concern on pre-production ECUs. The two CAN FD ports being genuinely independent is what allows VBOX 4 to do something many single-channel loggers can’t: synchronise two entirely separate CAN buses (say, powertrain and chassis) into one merged, time-aligned .asc file. No manual timestamp alignment, no separate log files to reconcile after the test. A Quick Refresher: What Is CAN FD, and Why Does It Matter Here? CAN FD (Flexible Data-Rate) is the modern evolution of the classic CAN bus protocol, developed to handle the data volume of today’s vehicles. Compared to classic CAN’s 8-byte payload per frame, CAN FD frames carry up to 64 bytes and transmit at significantly higher speed — which is why it’s become the standard on ADAS-equipped and electrified platforms with dozens of high-bandwidth ECUs. A logger that only supports classic CAN simply can’t see everything a modern vehicle is saying. VBOX 4’s CAN FD ports are built specifically to keep pace with this. Every Signal, Perfectly Timestamped Against GNSS Raw CAN capture is only half the story — the other half is timing accuracy. VBOX 4 synchronises every logged CAN and CAN FD frame against its GNSS position and speed data, so a suspension sensor reading, a brake pressure signal, or an ADAS target output can be correlated to the exact moment and location it occurred, down to the sample. This is what turns a bus log into genuinely usable engineering data rather than just a stream of hex frames with rough timestamps. Because the bus is captured with no filtering, VBOX 4 also handles fast-changing signals cleanly — things like suspension damper rates or high-frequency wheel dynamics, which are exactly the kind of signals that get missed or aliased on loggers that pre-filter or downsample the bus. From Raw Bus to Answers: VBOX Test Suite Capturing everything is only useful if you can make sense of it afterwards. This is where VBOX Test Suite, Racelogic’s analysis software, comes in: Post-test channel selection pick any combination of logged CAN signals after the fact, without having planned for them in advance Unlimited re-analysis the same raw log can be revisited any number of times for different questions, different projects, or different engineers Pre-configured test plugins standard test types (braking, ADAS scenarios, lane manoeuvres, etc.) come with built-in pass/fail logic, so results are available almost immediately rather than requiring a custom analysis script Open file format because the data is stored as standard .asc, it’s also compatible with third-party CAN analysis tools if your workflow needs them In practice, this means the test
Uncategorized

How to Use a G-Meter Brake Efficiency Tester: Step-by-Step Guide, Best Practices & FAQs

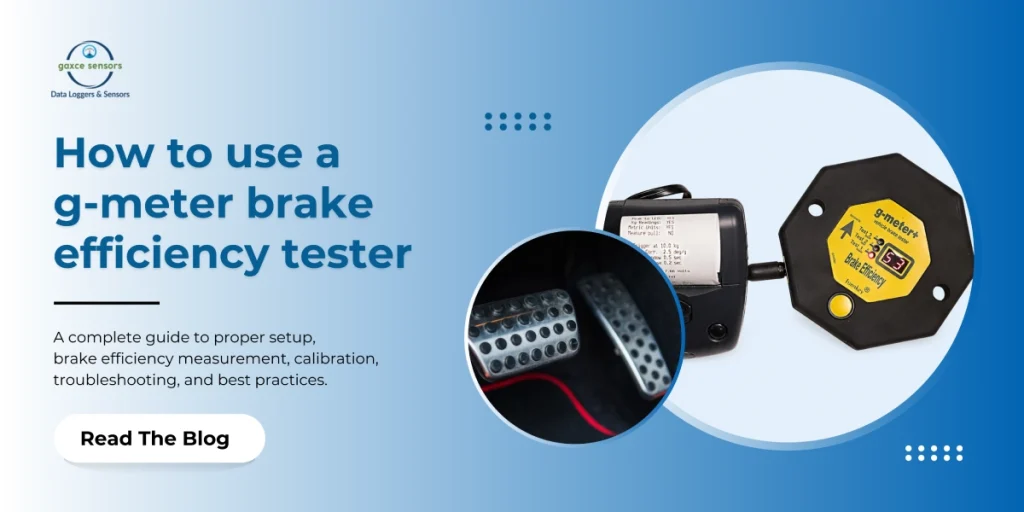
Quick Answer: How to Use a G-Meter for Brake Efficiency Testing Brake performance is one of the most safety-critical checks in any vehicle inspection. For vehicles that can’t be tested on a roller brake efficiency tester — certain trailers, HGVs, vintage vehicles, or vehicles with unusual axle configurations — a g-meter (decelerometer) is the go-to tool for statutory MOT brake efficiency testing. This guide walks through exactly how to use a g-meter, the official test procedure, common mistakes to avoid, and answers to the questions testers ask most. What Is a G-Meter Tester? A g-meter is a portable electronic decelerometer used for statutory MOT brake efficiency performance testing of Class I–VII vehicles and Heavy Goods Vehicles. It measures how quickly a vehicle slows down during braking and displays the result as either: Modern g-meters use a multi-axis electronic sensor rather than an old-fashioned mechanical pendulum. That gives testers several practical advantages: automatically senses the direction of travel, so precise placement isn’t critical stores the results of the last test, even after power-off timestamps every test automatically both are captured for a complete picture flags a low battery or an overdue calibration before you can misuse the device ensures results are legally defensible Key Specifications to Know Before You Start Feature Detail Measurement range 0 to 2.0 g Accuracy Better than ±3% g Display 2-digit, 7-segment LED, readable in sunlight Start window 0.5 seconds Brake threshold 10% g Tilt compensation 2.5 degrees per g Battery 9V PP3 alkaline (or CR2032 lithium backup) Battery life ~20 hours (PP3) Memory 1 test result Interface RS232C via 4-pole 2.5mm jack Understanding these specs matters because they explain why the device behaves the way it does — for example, why it needs a 0.5-second window to start recording, or why it won’t register a “test” until deceleration crosses the 10% g threshold. Step-by-Step: How to Use a G-Meter for Brake Efficiency Testing The 8 steps above cover the summary — here’s the full detail behind each one. Step 1: Switch the Device On Press and release the large yellow button. The display shows — briefly while the g-meter performs a self-check and recovers its last settings from memory. If E1, E2, or E3 flashes, stop and contact the manufacturer — do not proceed with a test. Step 2: Check the Battery and Calibration Status Do not carry out statutory testing if either warning is showing. Using an out-of-calibration or low-battery device invalidates the test and risks an unsafe pass/fail decision. Step 3: Position the G-Meter in the Vehicle Step 4: Arm the Device for a New Test Press and hold the button. The previous stored result is only overwritten once a new test is completed, so you won’t lose data by arming and then cancelling. Do not move the vehicle or disturb the g-meter until go is displayed. If you need to cancel, press the button again; the previous test result is retained. Step 5: Drive and Brake Following the procedure in the current MOT Inspection Manual: During the test, the display shows: The g-meter automatically detects the start and end of deceleration — you don’t need to press anything mid-test. Step 6: Read and Record the Result Once the test completes, the g-meter retains the peak and mean deceleration figures in memory. You can toggle the display between: Record the figures against the vehicle’s required Brake Efficiency Table values. Step 7: Switch Off The g-meter automatically powers off if the button isn’t pressed for 4 minutes (it will not auto-off while armed for a test). To switch off manually, double-click the button. Roads Suitable for Decelerometer Testing Not every road is appropriate for a decelerometer brake efficiency test. The test road should: Testing Transmission Handbrakes When testing a transmission-type handbrake with a decelerometer, keep the ratchet disengaged for as long as the brake is applied, and take the efficiency reading before any transmission snatch or judder occurs. Snatch/judder can produce a falsely high or erratic reading. Best Practices for Accurate G-Meter Testing Common Mistakes to Avoid Mistake Why It’s a Problem Testing with the Lo battery warning flashing Statutory results become invalid; battery-related sensor drift is a real risk Testing with the cd calibration warning flashing Calibration is a legal requirement for statutory MOT testing — results won’t hold up Moving off before go appears The device hasn’t finished tilt compensation, so accuracy is compromised Mounting the g-meter loosely or on an angled surface Movement or excessive tilt during braking skews peak/mean readings Ignoring steering pull or swerve during the service brake efficiency test This is a specific rejection criterion in the MOT Inspection Manual, independent of the numeric efficiency reading Testing transmission handbrakes through snatch/judder Produces an inaccurate efficiency figure Overusing the same public road for repeat testing Can generate resident complaints and isn’t in line with recommended practice Reasons a Vehicle Fails a Decelerometer Brake Efficiency Test According to the MOT Inspection Manual method of inspection, a vehicle should be rejected if: Frequently Asked Questions (FAQs) What is a g-meter used for? A g-meter (decelerometer) is used for statutory MOT brake performance testing of vehicles that can’t be tested on a roller brake efficiency tester, measuring brake efficiency efficiency as a percentage or deceleration in metres per second squared. What speed should I drive at for a decelerometer brake efficiency test? The MOT Inspection Manual specifies driving at a steady speed of approximately 20 mph (32 kph) on a level road before applying the brake being tested. How accurate is a g-meter? A typical g-meter offers accuracy better than ±3% g, with 1% g resolution on the LED display, and uses UKAS-traceable multipoint calibration. Can I use a g-meter if the calibration is overdue? No. If the display flashes cd, calibration is due and the instrument must not be used for statutory testing until it’s recalibrated. What does it mean if the g-meter shows Lo? Lo means the battery is exhausted and needs replacing with a 9V PP3 alkaline battery. Do

Scroll to Top